Single Family Homes

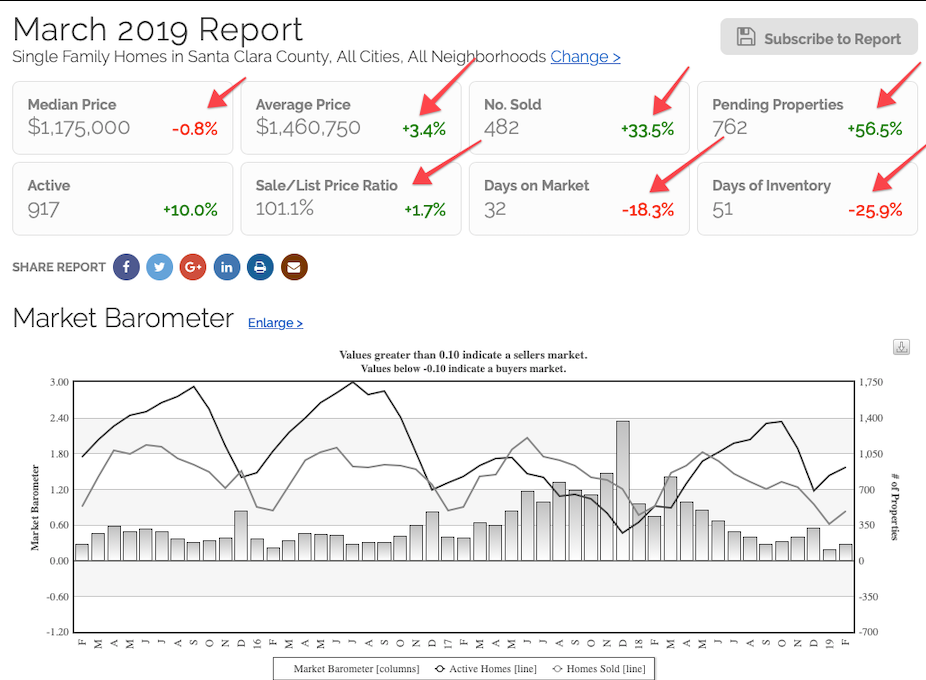
Last month was the first month where the Sale/List Ratio fell below 100% for the first time since 2012. However, there was a lot of buzz and activity which we had not seen in many months since the start of the year. We were seeing the return of multiple offers for homes in better conditions. Something was happening. THERE IS STILL A LOT OF BUZZ in the market place.
Within a month, the downward trend in pricing and sales activity quickly reversed from its long trajectory with most noticeably the lowering of mortgage rates.
Sale/List Ratio went from 99.5% to 101.1% and the number of units sold, pending properties all went up. At the same time, Days on Market and Days of Inventory fell dramatically. All the indicators showing a noticeable reverse in trajectory since last summer. These are significant changes.
Pending properties from 487 to 762
Units Sold from 361 to 482
Days on Market from 39 to 32
Days of Inventory from 69 to 51
Condo/Townhomes

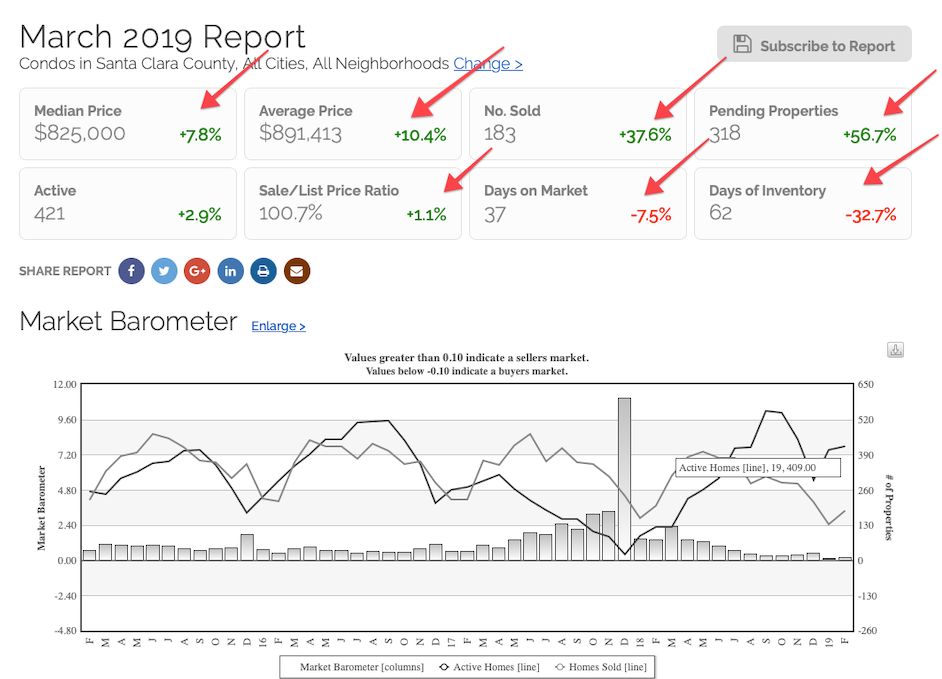
Same applies for condo/townhomes as well. After nine months of a downward trend, it quickly reversed course last month.
Pending properties from 203 to 318
Units Sold from 133 to 183
Days on Market from 40 to 37
Days of Inventory from 92 to 62

The above is the three largest cities in Silicon Valley to get an idea of what is happening now.
Again, next month will be an interesting month to see.
Keep in mind, however, that these are overviews of the County as a whole. The scenarios may be different depending on each city and particular neighborhood.
Please contact me if you would like data which are more specific to your neighborhood or ideas about how to make your home stand out above all the rest.
#siliconvalleyrealestate #realestatenews #realestatesales #siliconvalleyrealestatemarket #siliconvalleymarkettrend #santaclaracountymarkettrend #siliconvalleymarketreport #santaclaracountymarketconditions #kwsv #kellerwilliams #stevemungroup #whoyouhireabsolutelymatters #work #realtor #realestate #siliconvalleyrealestate


